The 10 US Cities With the Hardest Water (2026 Data)
The hardest tap water in the US, ranked from each city's own water quality report: Indianapolis, Chandler, Las Vegas, San Diego, San Antonio and five more.
By Home Water Lab TeamUpdated Prices verified Oct 7, 2026
The hardest tap water in a large US city belongs to Indianapolis, at an average of 19 grains per gallon according to its own utility. Arizona, Nevada, Southern California and San Antonio fill most of the rest of the list. Every number below comes from the utility that delivers the water, read on November 2, 2026, not from a national map. For what hardness actually is and what it does to a house, start with our hard water guide, then come back for the city numbers.
The short answer
as of Nov 2, 2026Which US cities have the hardest water?
Ranked by each utility's own published figure: Indianapolis (19 gpg average), Chandler, AZ (16.5 gpg), Las Vegas (16 gpg), San Diego (about 16 gpg), San Antonio (15 to 20 gpg), Scottsdale (13 to 17), Mesa (12 to 22), Tampa (10.8 average), Phoenix (10 to 17.6) and Omaha (about 10). Nine of the ten reach the USGS very hard band, which starts above 180 mg/L, about 10.5 gpg; Omaha, softened at the plant, sits just under it.
Key takeaways
- Indianapolis has the highest published average of any large city we checked: 320 mg/L, 19 gpg (Citizens Energy Group).
- Four of the ten cities are in Arizona: Chandler, Scottsdale, Mesa and Phoenix.
- Las Vegas gives 16 gpg (280 ppm) as its softener setting; San Diego averages about 16 gpg (276 ppm).
- Omaha softens its water at the plant and still delivers about 10 gpg, which the USGS calls hard.
- Neighbors differ: Gilbert, AZ averages 8 to 10 gpg while Chandler next door averages 16.5.
Which US Cities Have the Hardest Water?#
Indianapolis leads, followed by a cluster of Southwest cities at 16 grains per gallon or more. The table keeps each utility's own wording: an average where it publishes one, a range where it publishes only a range.
| Rank | City | Utility | Published hardness | In mg/L (ppm) | Source |
|---|---|---|---|---|---|
| 1 | Indianapolis, IN | Citizens Energy Group | 19 gpg average | 320 average | Drinking water report page |
| 2 | Chandler, AZ | City of Chandler | 16.5 gpg average | 173 to 288 (2024 report) | Water quality FAQ, 2024 report |
| 3 | Las Vegas, NV | Las Vegas Valley Water District | 16 gpg | 280 | Water quality report, 2025 data |
| 4 | San Diego, CA | City of San Diego | about 16 gpg average, 16 to 18 | 276 average, 272 to 284 | Water quality page |
| 5 | San Antonio, TX | San Antonio Water System | 15 to 20 gpg typical | not published | Water quality FAQ |
| 6 | Scottsdale, AZ | Scottsdale Water | 13 to 17 gpg | 215 to 290 | 2025 water quality report |
| 7 | Mesa, AZ | City of Mesa | 12 to 22 gpg | not published | Water quality page |
| 8 | Tampa, FL | Tampa Water Department | 10.8 gpg average | 185 average | 2024 water quality report |
| 9 | Phoenix, AZ | City of Phoenix | 10 to 17.6 gpg | 172 to 302 | Current water quality report |
| 10 | Omaha, NE | Metropolitan Utilities District | about 10 gpg | about 170 | Your Water page |
Grains per gallon, USGS classes
as of Nov 2, 2026- Dot: published average
- Bar: published range
- Indianapolis, Citizens Energy GroupAverage 320 mg/L, 19 gpg, on the utility's drinking water report page.
- Chandler, AZ, City of ChandlerAverage 16.5 gpg on the city's FAQ; its 2024 report shows 10.1 to 16.8 gpg.
- Las Vegas, Las Vegas Valley Water Dist.280 ppm, 16 gpg, the figure the district gives for setting a softener (2025 data).
- San Diego, City of San DiegoAverages about 16 gpg (276 ppm), 16 to 18 gpg depending on area and demand.
- San Antonio, SAWSTypical hardness 15 to 20 gpg, per the SAWS water quality FAQ.
- Scottsdale, Scottsdale Water13 to 17 gpg across its three zones in the 2025 water quality report.
- Mesa, AZ, City of Mesa12 to 22 gpg depending on the source that serves your area.
- Tampa, Tampa Water Department2024 average 185 mg/L, 10.8 gpg; the city's FAQ gives about 8 to 17 gpg by season.
- Phoenix, City of Phoenix172 to 302 ppm, 10 to 17.6 gpg, in the current water quality report.
- Omaha, Metropolitan Utilities Dist.Lime-softened at the plant to about 170 mg/L, 10 gpg, per the district.
Figures read Nov 2, 2026 on each utility's own water quality page or annual report. A range is shown as published, never turned into an average. USGS classes: soft 0 to 60 mg/L, moderately hard 61 to 120, hard 121 to 180, very hard above 180, at 1 gpg = 17.1 mg/L as CaCO3. Hardness at a given address varies with the source feeding it and the season; your utility can give the figure for your zone.
How Did We Rank the Cities?#
By the number each utility prints itself. Nothing else. An average comes first. Where a utility publishes only a range, we rank by the low end of that range, so no city climbs the list on an assumption.
That rule has a cost, and you can see it in the table. San Antonio's range runs to 20 gpg, higher than San Diego at its peak, yet it sits fifth because its floor, 15 gpg, is lower than San Diego's 16. Turning a range into an average would have been arithmetic on numbers SAWS never published as an average, and we don't do that.
We also left out cities whose figures we could not read on the utility's own page today. That's why a few names you see on other lists, built from national maps or from water treatment dealers' own surveys, are missing here.
Why Is the Water So Hard in Arizona and Nevada?#
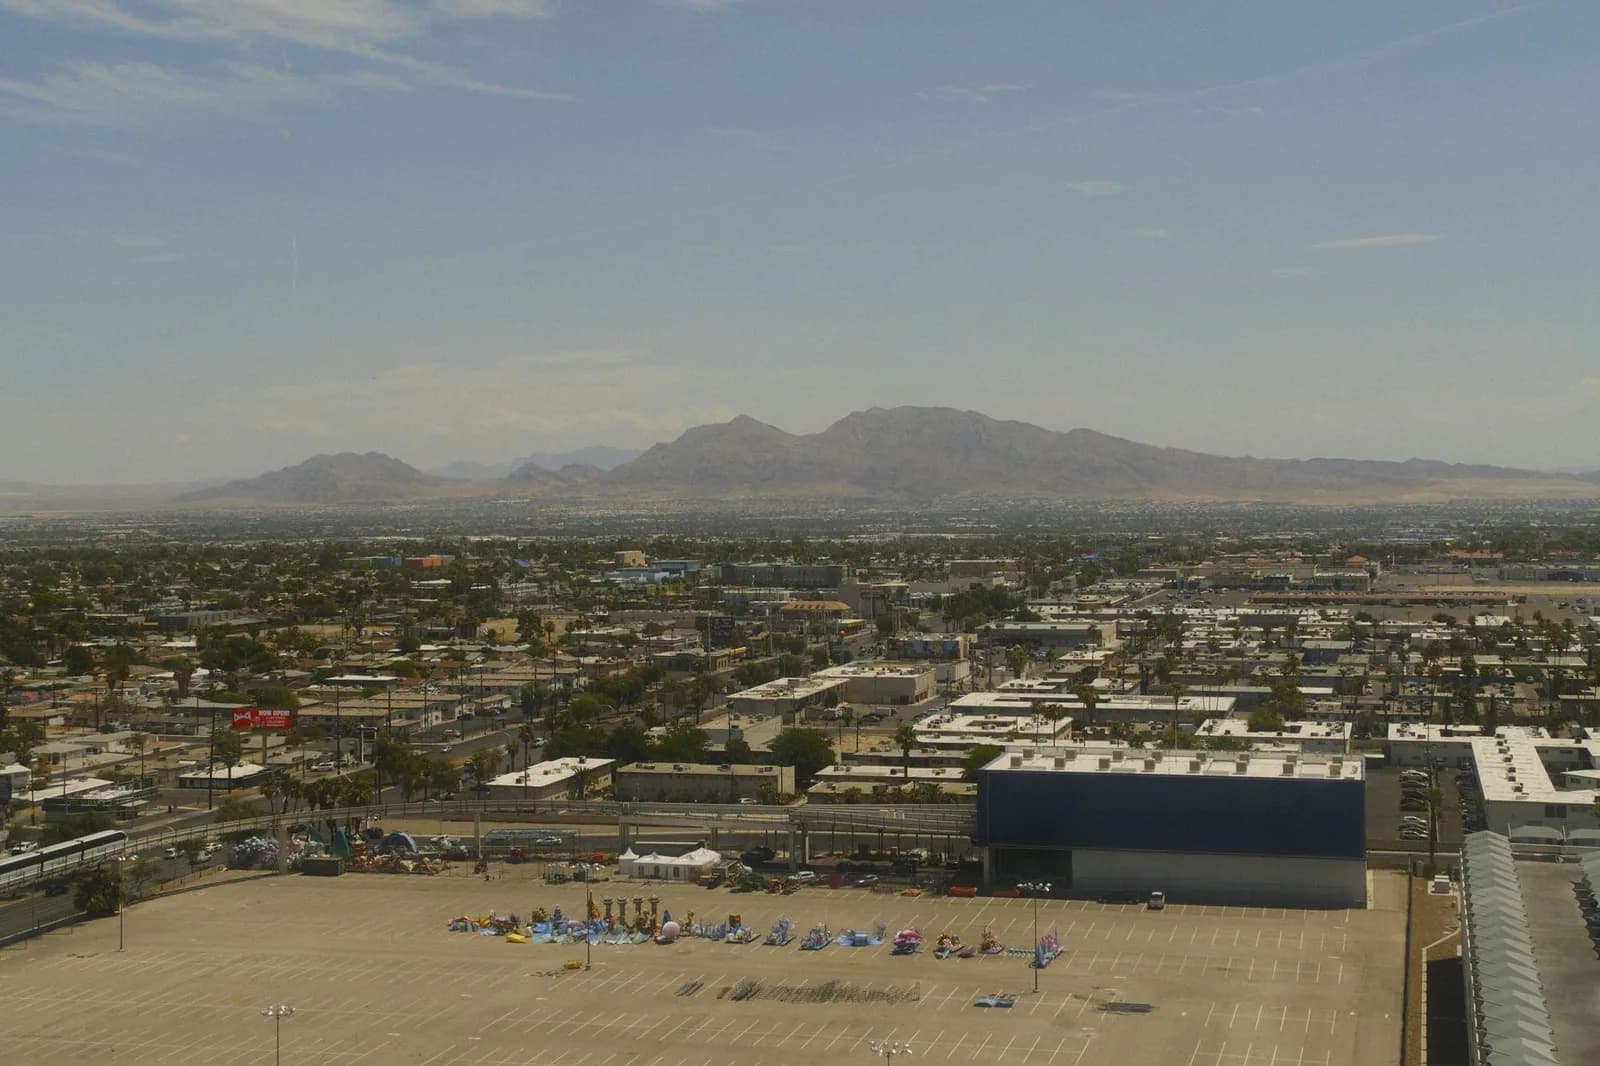
River water. These cities drink rivers and reservoirs that are already heavy with dissolved calcium and magnesium long before any of it reaches a treatment plant, and most plants are built to make water safe, not soft. The Las Vegas Valley Water District says its calcium and magnesium are carried into Lake Mead from the mineral-dense Colorado River.
In the Phoenix metro, the Salt, Verde and Colorado Rivers are blended with local groundwater, and each city draws a different mix. That is how Chandler can average 16.5 gpg while Gilbert, next door, gives 8 to 10 gpg. Our state pages carry the wider picture for Arizona's hardness by region and for Nevada, where Reno runs far softer than Las Vegas.

Why Is Indiana Water So Hard?#
Central Indiana's sources pick up calcium and magnesium naturally, and Citizens Energy Group calls that common for the region. Its average of 320 mg/L is the highest average any utility on this list publishes.
The state page for hardness levels across Indiana shows the same pattern beyond Indianapolis. Across the border in Texas, San Antonio's Edwards aquifer supply explains the 15 to 20 gpg SAWS reports, and in California the answer depends on which aqueduct serves you, as our California hardness page lays out.
What you hear
If the city treats the water, it must be soft.
What the numbers say
Omaha's utility lime-softens its water and still delivers about 170 mg/L, roughly 10 gpg. That is hard on the USGS scale. Treatment for safety and softening for scale are two separate jobs.
Which Big Cities Have Softer Water Than You'd Expect?#
Kansas City, Austin and Milwaukee. All three come in well below the top ten. KC Water gives an average of 100 mg/L, 5 to 6 gpg, which is moderately hard. Austin Water's report shows an average of 93 ppm, 5.4 gpg, with a range of 4.1 to 7.4.
Milwaukee, on Lake Michigan water, publishes 8.01 gpg (137 mg/L). That still counts as hard on the USGS scale, but it is well under half of Indianapolis. Los Angeles is the clearest case of one city with several answers: LADWP's area averages run from 8.6 gpg in the San Fernando Valley and Western Los Angeles to 16.3 gpg in Eastern Los Angeles and the Harbor.
8.6 to 16.3 gpg
What Should You Do If You Live in One of These Cities?#
Get the number for your own zone first. Then decide whether the scale bothers you enough to treat it, keeping in mind that a softener sized on a city average can be too small for a house fed by the hardest source in that city. At 16 to 19 gpg the effects are hard to miss: crust on faucets, spotted glassware and scale building up inside the water heater. Our walkthrough on getting hard water stains off fixtures handles the cleanup side.
From city figure to the right fix
Find your zone's figure
Read your utility's water quality report or call it. Mesa, Chandler, Scottsdale and Los Angeles all publish different numbers for different parts of the city.Confirm at your tap
A strip or titration kit reads your own water in minutes. Our picks for a reliable hardness test kit are on the kits page.Size a softener on the real number
Hardness times household water use sets the grain capacity. Plug your figure into the sizing calculator rather than guessing from a city average.Price the whole ownership
Salt, power and maintenance matter as much as the box. Compare before you buy.
For the test, our roundup of the best hard water test kits compares strips and drop kits. For the sizing, the water softener sizing calculator turns your grains and household size into a capacity. Then the water softener buying hub explains how the systems work, our ranked list of the best water softeners narrows the field, and what a softener really costs to buy and run covers the bill.
How Do I Find the Hardness for My Own Address?#
Read your utility's report. It's the Consumer Confidence Report every community system must publish each year, and many list hardness with the aesthetic results, as Phoenix's does. Most of the figures in this article came from exactly those reports and the FAQ pages that go with them.
Our walkthrough of finding and reading your water quality report shows where hardness sits in it, and whether your tap water is safe to drink gets its own guide. If your city is not listed here, the USGS hardness map for all 50 states gives the USGS classification and a typical range for all 50 states and DC. The science behind the grains and the ppm is in our explainer on how hardness is measured.
Read Nov 2, 2026: Citizens Energy Group, Indianapolis Area Drinking Water Report page; City of Chandler, Water Quality FAQs and 2024 Drinking Water Quality Consumer Confidence Report; Las Vegas Valley Water District, Water Quality Report (2025 data) and 2026 Water Quality Summary (its FAQ page also gives 291 ppm, 17 gpg); City of San Diego, Water Quality page; San Antonio Water System, Water Quality FAQs; Scottsdale Water, 2025 Water Quality Report; City of Mesa, Common Water Quality Concerns; Tampa Water Department, 2024 Water Quality Report and FAQ; City of Phoenix, current Water Quality Report; Metropolitan Utilities District (Omaha), Your Water; Town of Gilbert, Water FAQ; KC Water, Water Quality Topics; Austin Water, Water Quality Reports; Milwaukee Water Works, Water hardness; LADWP, Water Quality FAQs. USGS hardness classes from the USGS Water Science School. Conversions at 1 gpg = 17.1 mg/L as calcium carbonate.
Hardest water by city: what people ask
Where is the hardest water in the US?
Among large cities that publish a figure, Indianapolis (19 gpg average) and the Southwest cluster: Chandler, Las Vegas, San Diego, San Antonio, Scottsdale, Mesa and Phoenix.
What city has the hardest water in Arizona?
On published figures, Chandler's 16.5 gpg average is the highest single average among the Arizona cities we checked. Mesa's range reaches 22 gpg at its top, and Scottsdale's 2025 report gives 13 to 17 gpg.
Is Las Vegas water harder than Phoenix water?
On average, yes. Las Vegas gives 16 gpg (280 ppm) as its setting. Phoenix publishes a range of 10 to 17.6 gpg, so some Phoenix addresses can match Las Vegas while others run softer.
Does the hardest water need a water softener?
Not for safety: hardness is not a health risk. A softener is worth it when scale costs you more in heaters, fixtures and cleaning than the system costs to run, which becomes likely at the 16 gpg and up levels these cities publish.
Frequently asked questions
Which US city has the hardest water?
Among the large cities whose utilities publish a hardness figure, Indianapolis comes out on top: Citizens Energy Group gives an average of 320 mg/L, or 19 grains per gallon. Chandler, Arizona averages 16.5 gpg, and Las Vegas and San Diego both sit at about 16 gpg. San Antonio's own range, 15 to 20 gpg, reaches higher at its top end.
What state has the hardest water?
There is no single official ranking, but the hardest city supplies cluster in Arizona, Nevada, Texas, Indiana and Southern California. Arizona puts three cities in this top 10 (Chandler, Scottsdale and Mesa) plus Phoenix. The USGS classes anything above 180 mg/L, about 10.5 gpg, as very hard, and nine of the ten cities on this list reach that band, at least part of the time.
Why is Arizona water so hard?
Most of it is river water that arrives already loaded with dissolved minerals. Phoenix, Mesa, Chandler and Scottsdale draw on the Salt, Verde and Colorado Rivers plus local groundwater, and Mesa says hardness at a given address depends on which source serves it, which is why it publishes 12 to 22 gpg.
Why is Indiana water so hard?
Central Indiana's sources pick up calcium and magnesium naturally, which Citizens Energy Group says is common across the region. Indianapolis averages 19 gpg, and the utility notes that hardness varies with the source water feeding each treatment plant, so the figure for your address can differ from the average.
Is very hard water safe to drink?
Yes. The utilities here that address it, including Las Vegas, San Antonio, Phoenix, Mesa and Chandler, all say hardness is not a health risk, and Chandler notes the EPA has set no maximum contaminant level for it. What it does is leave scale in pipes, heaters and fixtures, which is a cost question rather than a safety one.
Keep reading

Not sure what you need?
Answer 5 questions, get the right system for your water.
City or well, budget, household size, our quiz matches your answers against every system we track.